Infographic: predicting diabetes with EHRs
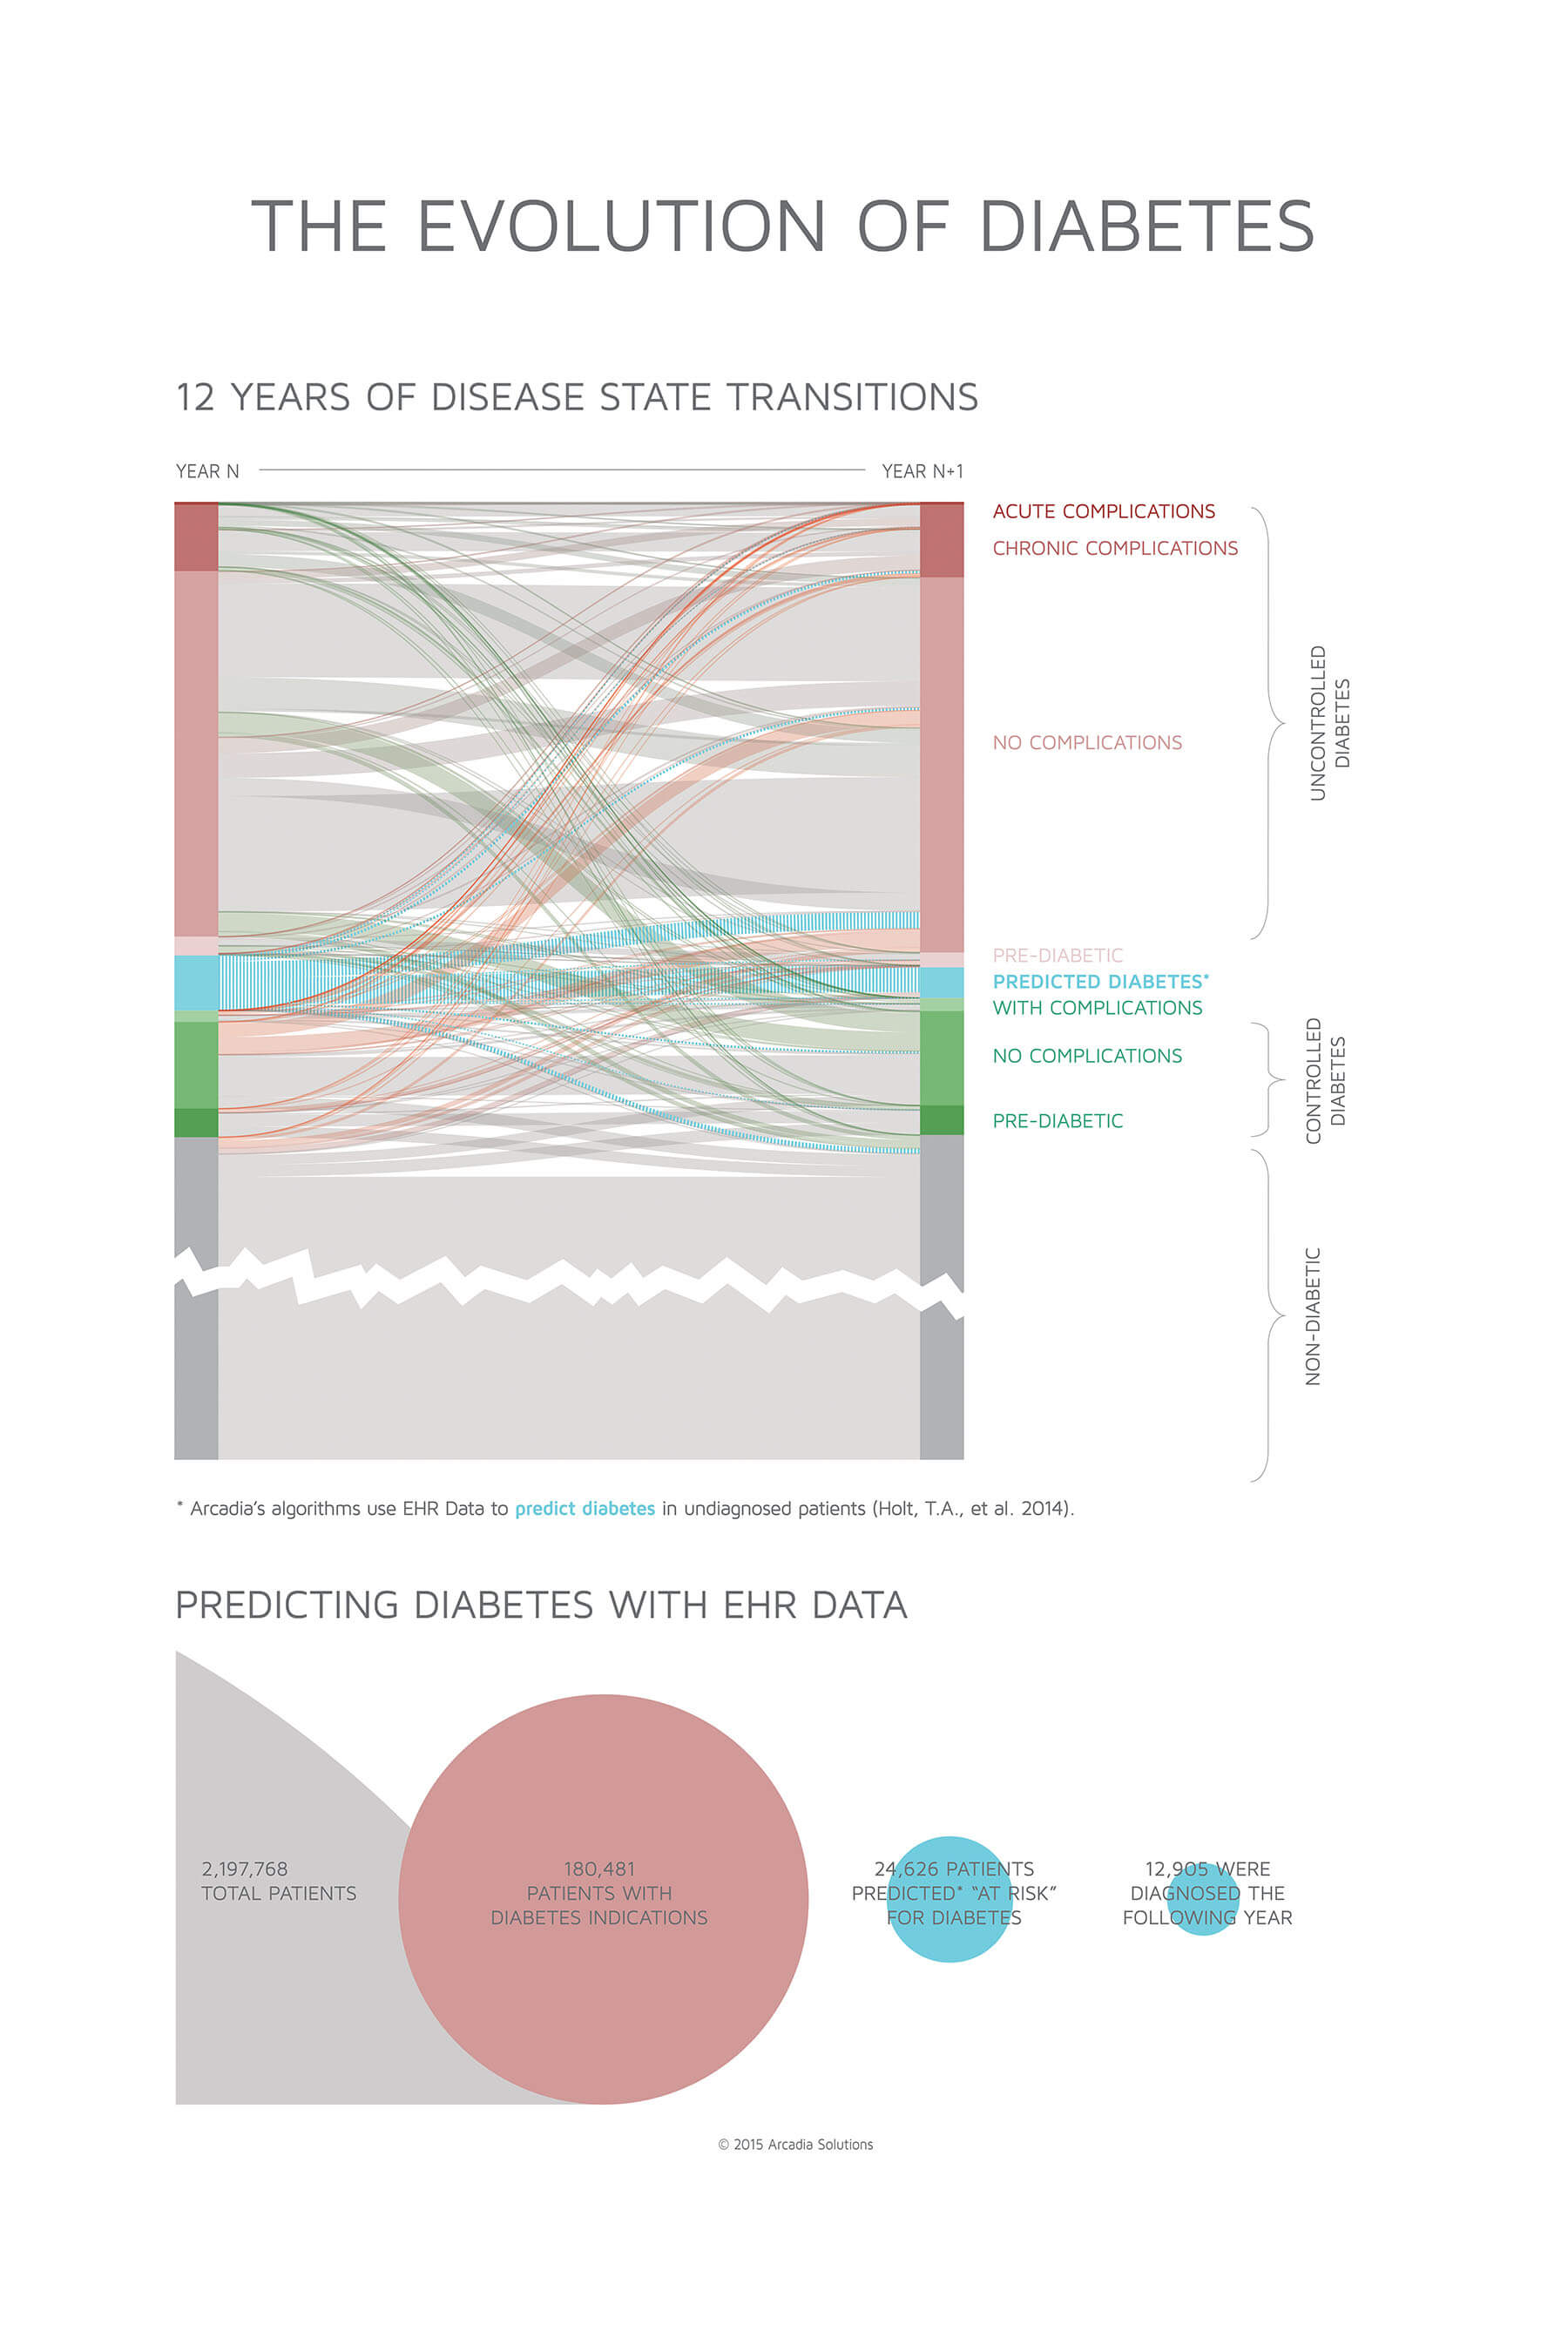
Based on de-identified claims and EHR data of more than 10 million people, this infographic from Arcadia Healthcare Solutions shows a decade-plus of diabetic patient data, normalized to show the movement of various states of severity and control of the condition.
Rising red lines represent patients initially diagnosed with diabetes, or whose diagnosis increases in complexity, as defined by lab and assessment data from the EHR, according to Arcadia. Swooping green lines show patients going in the opposite direction, moving into a position of better condition management.
In this longitudinal study, Arcadia implemented a predictive algorithm that leveraged lab result data to identify undiagnosed diabetics, which represent some 25 percent of diabetics nationwide, according to CDC. It found a group of patients – over 13 percent the size of the known diabetic population – at a high likelihood of being diagnosed with diabetes in subsequent years. Forty-five of those patients were diagnosed the following year.
Nationally, the incidence of new cases of diabetes was 7.8 per 1,000 individuals in 2012, meaning the predicted group had an incidence rate over 50 times that of a general population, according to Arcadia.
Click image to enlarge.